Definition: An instrument that is used for the analysis of the frequency spectrum of the input signal is known as a spectrum analyzer. It uses frequency domain representation of the RF signals in order to show the relative amplitude level of the signal at various frequencies within a particular range.
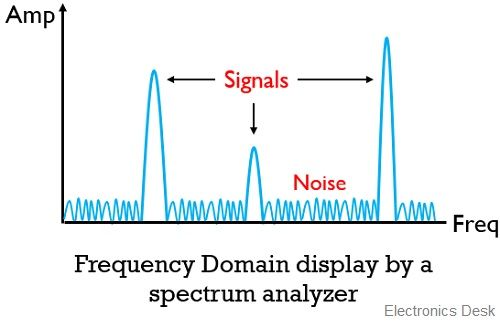
A signal which shows the plot where the vertical axis represents the amplitude. While the horizontal axis indicates the frequency is known as frequency domain representation.
Content: Spectrum Analyzer
What is Spectrum Analyzer?
A spectrum analyzer is considered as a device that is used for the analysis of the amplitude of the signal with respect to frequency. So, an input waveform provided to a spectrum analyzer is analyzed on the basis of varying frequency.
This test equipment is majorly used in designing, testing and maintaining RF circuitry.
It graphically displays the amplitude spectrum of radio signals with respect to frequency. The amplitude is represented vertically on a logarithmic scale. While the frequency can be represented on logarithmic or normal scale horizontally.
The use of a logarithmic scale on the vertical axis allows judgement of large differences in amplitude of various signals.
We know that commonly an oscilloscope is used to display waveform as its output when an input signal is provided to it. However, an oscilloscope is used for the time domain analysis of signals. This means that the waveform of the signal at the output represents the amplitude vs time plot.
Therefore, the crucial difference between the oscilloscope and spectrum analyzer is that an oscilloscope corresponds to the time-domain representation of the input signal. While the spectrum analyzer is used to show the frequency domain representation of the RF signals.
Need of Analyzers
We know in the wireless communication system; the signal is transmitted from an end to another. This signal is nothing but the message which is required to be sent to the other end for communication to take place.
However, during transmission, the signal gets degraded. This degradation in the signal level is mainly due to the introduction of noise in the communication channel as well as the receiver. Thus we can say, noise interferes with the signal and deteriorate the quality of the signal.
The introduction of noise in the signal leads to limit the range of transmission and the effectiveness of measuring the signal at the receiver. This causes the result to fluctuate from its original value.
Basically, the addition of noise during transmission can be in two ways i.e., internally and externally. This leads to classifying noise as internal noise and external noise.
So, analyzers or spectrum analyzers are used for the quantitative assessment of signals and distortion because of noise during transmission between the two antennas.
Block Diagram of Spectrum Analyzer
Till now we have discussed the basic introduction of the spectrum analyzer. It is noteworthy here that the swept-tuned receiver is the commonly used spectrum analyzer. It is one of the most used frequency measurement tools.
This type of analyzer undergoes sweeping across the frequency range, thereby displaying the present frequency components in that particular signal. As it allows the measurement of a large frequency range, thus makes the frequency domain analysis quite easy for various applications.
Suppose for an input signal of 2 MHZ, the analyzer sweeps across the complete 2 MHZ frequency band in order to have the complete frequency domain analysis.
The figure below shows the block diagram representation of a spectrum analyzer with digital display:
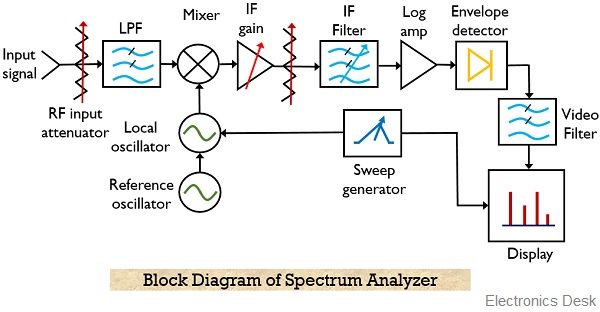
As we can see the spectrum analyzer is composed of components like RF attenuator, mixer, IF filter, detector, sweep generator, local oscillator and display unit.
So, let us now understand the operation performed by each block individually.
- RF Input Attenuator: This block serves as the first unit of the spectrum analyzer and is basically used to provide an optimum level signal as the input to the system. This is so because when high broadband signals are supplied to the system then there exist chances of overload, gain compression and distortion.
Thus to provide a signal of appropriate level RF attenuator is used. It is set automatically based on the reference level, however manually setting the value is also permissible. Hence we can say it acts as the protective circuit for the system.
- Low pass filter: We know that a low pass filter blocks the high-frequency components of the signals and allows only low-frequency components to pass further. Thus by using LPF the out of band signals are not permitted to reach the successive units of the system. This restricts the system to give an unwanted response.
Some systems use, a pre-selector rather than LPF. This pre-selector serves the purpose of the bandpass filter by rejecting all the other frequency components and permitting the desired frequency only.
- Mixer: As we can see in the block diagram that there are 3 ports of the mixer. It basically acts as a frequency translator and converts one form of frequency into another. The applied input signal and the signal from the local oscillator are the two inputs of the mixer.
The mixer generates output. The output frequencies of the mixer are the two applied input frequencies as well as the sum and difference frequencies of the two input frequencies.
However, the difference between the two frequencies is the intermediate frequency which is utilized by the analyzer.
- IF gain: It is the variable gain amplifier. It is present after the mixer and is used for the adjustment of the vertical position of the signal without altering the signal level of the mixer input.
It is designed in coupling with the input attenuator so as to avoid variation in reference level with the change in applied input.
- IF filter: It is basically a bandpass filter that is centered at the intermediate frequency. Thus is designed to pass only the desired frequency component. The bandwidth of the IF ( intermediate frequency) filter is referred as resolution bandwidth of the spectrum analyzer.
With the reduction in RBW, the selectivity gets improved along with signal to noise ratio. However, this causes a reduction in the sweep speed.
- Detector: Basically analyzer uses a detector so that the IF signal from the IF filter gets converted into baseband or video signal. This video signal further digitized using ADC and is showed on the y-axis of the display.
For one trace element during the positive detection mode, the peak value of the signal is considered. While in negative detection mode, the minimum value is considered.
For the detection of signals having noise components, mostly normal mode also known as rosenfell mode is used. This is so because on experiencing, sudden rise and fall in the signal level, the detector assumes it to be noise and makes use of positive and negative detection alternately.
However, a continuous rise in signal level corresponds to the original signal thus positive peak detection mode is used.
- Video Filter: This unit acts as an intermediary between the detector and the ADC and is basically a low pass filter. It is used to smoothen the traces that are to be displayed on the screen.
We have already discussed that the spectrum analyzer displays the signal and noise component on the screen. So, if the noise content is higher, then it will be more difficult to study the signal. However, the change in video bandwidth causes a reduction in peak to peak variations in noise components.
Thus by using this, actual signals can be obtained with a higher noise component.
- Local Oscillator: This is used to tune the analyzer and is basically a voltage controlled oscillator. The LO is tuned by the sweep generator so that the frequency varies according to the ramp signal voltage.
Along with this, the video signal is sampled using ADC in synchronization with the sweep generator.
As already the relationship between the input signal and local oscillator is known, thereby permitting the calibration of the x-axis in terms of frequency. This leads to creating the frequency domain on the horizontal axis.
Hence from this discussion operation of each block can be combined to have the overall working of the spectrum analyzer.
Working of Spectrum Analyzer
Initially, the signal to be analyzed is provided to the RF attenuator which sends the optimum signal to the mixer. The mixer combines the input signal and the signal received from the local oscillator to generate a signal of intermediate frequency.
Further, the signal is provided to the IF filter whose output is provided to the detector so that the signal can be detected at the tuned frequency. The voltage at the output of the detector shows the amplitude of the signal and drives the y-axis of the plot to be displayed.
The synchronization between the sweep generator and LO provides the frequency response. This leads to producing, amplitude vs frequency plot at the LCD display of the analyzer.
Applications of Spectrum Analyzer
The swept receiver type of spectrum analyzer finds applications in various fields such as telecommunication equipment, mobile communication system, and broadcasting equipment. Along with this, spectrum analyzers are used in microwave communication links, radar, and cable TV systems, etc.